The Number Everyone Got Wrong
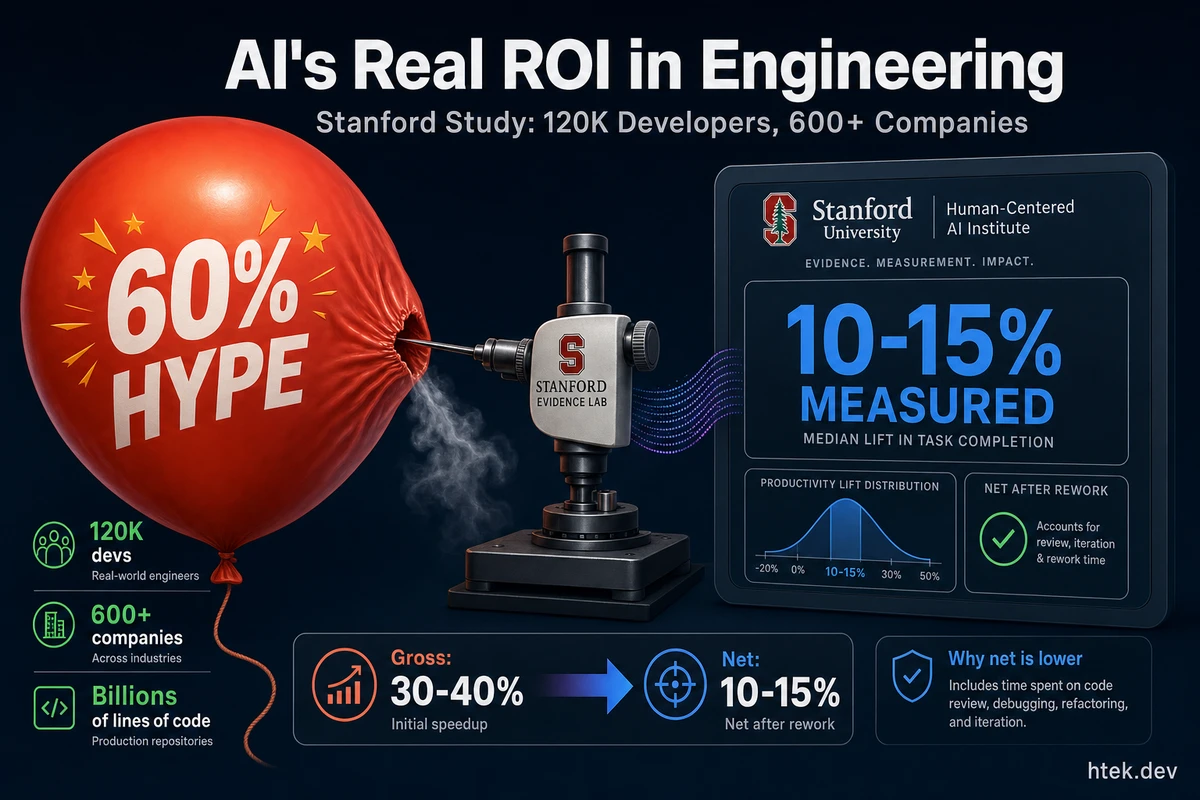
The AI vendor pitch is seductive: “60% productivity gains for developers!” It’s the kind of stat that gets budget approved and tools deployed overnight. But when Yegor Denisov-Blanch, a researcher at Stanford’s Graduate School of Business, analyzed ~120,000 developers across 600+ companies — tens of millions of commits and billions of lines of private code — the actual number landed with a thud.
The median productivity lift from AI tools is 10–15%. Not 60%. Not even close.
I shared this research on LinkedIn after watching Denisov-Blanch’s talk at the AI Engineer Code Summit, and the reactions were split — some leaders deflated, others relieved to finally have honest data. Here’s my breakdown of what the study actually found, what it means, and why the nuance matters more than the headline.
How Stanford Measured What Others Can’t
Most AI productivity studies measure the wrong things — PR counts, lines of code, or developer self-reports. Stanford took a fundamentally different approach, detailed in their foundational paper (Stanford GSB working paper):
- Expert panel calibration — Panels of 10–15 senior engineers with repository context evaluate actual code changes for complexity, implementation time, and quality.
- ML model at scale — Trained on those expert evaluations with strong correlation to human judgment (r = 0.82 for coding time, r = 0.86 for implementation time).
- Functionality delivered, not activity volume — Measures real output, not commits or keystrokes.
- Private codebases — Real enterprise code, not sanitized open-source demos.
This matters because, as Denisov-Blanch explained on the Aviator Hangar DX Podcast, the team deliberately avoids the word “productivity” in favor of “developer output” — what actually ships to production.
The Rework Tax: Where the Gains Disappear
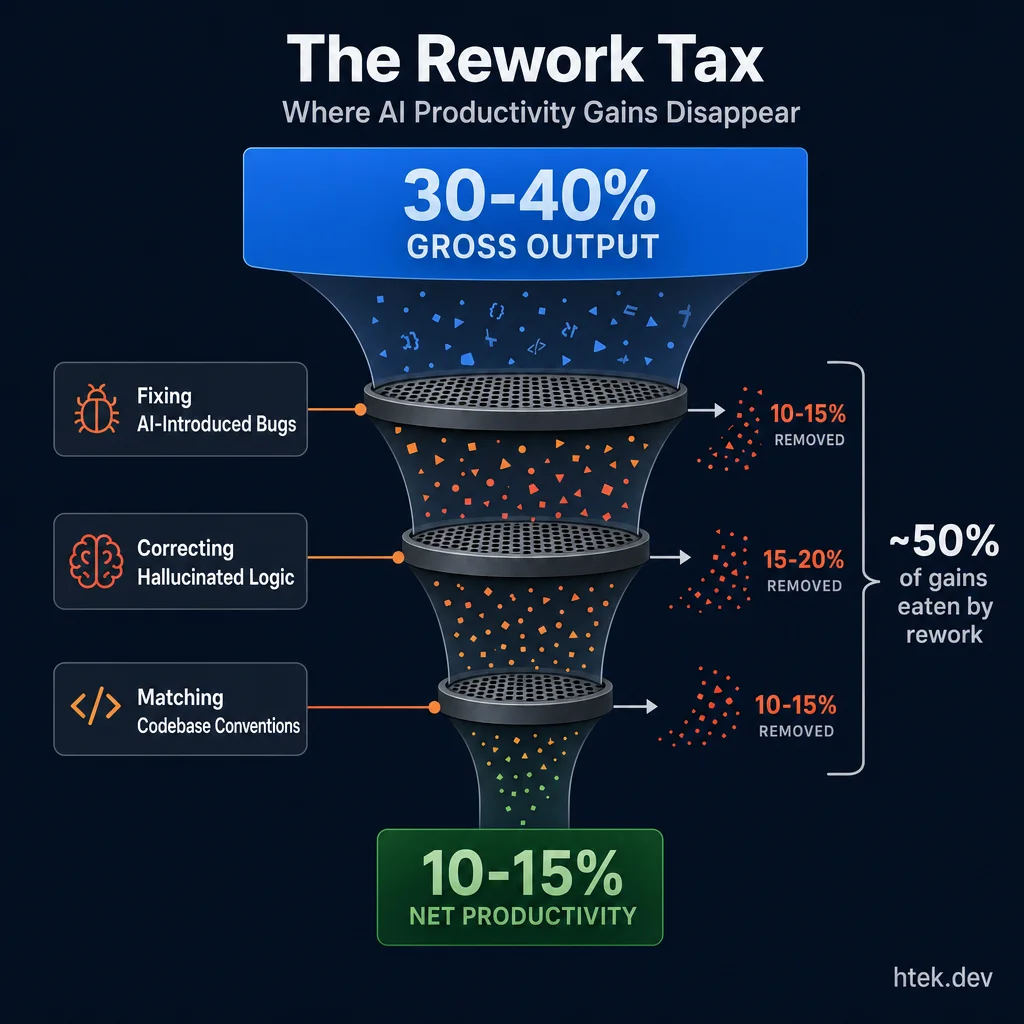 Roughly half of AI’s gross productivity gains get consumed by rework — fixing bugs, correcting hallucinated logic, and matching codebase conventions.
Here’s the finding that should be on every engineering leader’s whiteboard:
| Metric | Value |
|---|---|
| Gross output increase (raw code volume) | 30–40% |
| Net productivity after rework | 15–20% |
| Median lift across all teams | 10–15% |
| Top-quartile teams | 20–30% |
| Bottom-quartile teams | 0% or negative |
AI generates more code faster — no question. But roughly half of those gross gains get eaten by rework: fixing AI-introduced bugs, correcting hallucinated logic, and cleaning up code that doesn’t match the codebase’s conventions. I’ve seen this firsthand. The initial dopamine hit of watching Copilot scaffold a feature wears off fast when you’re debugging subtle regressions for the next two days.
Context Is Everything: Greenfield vs. Brownfield
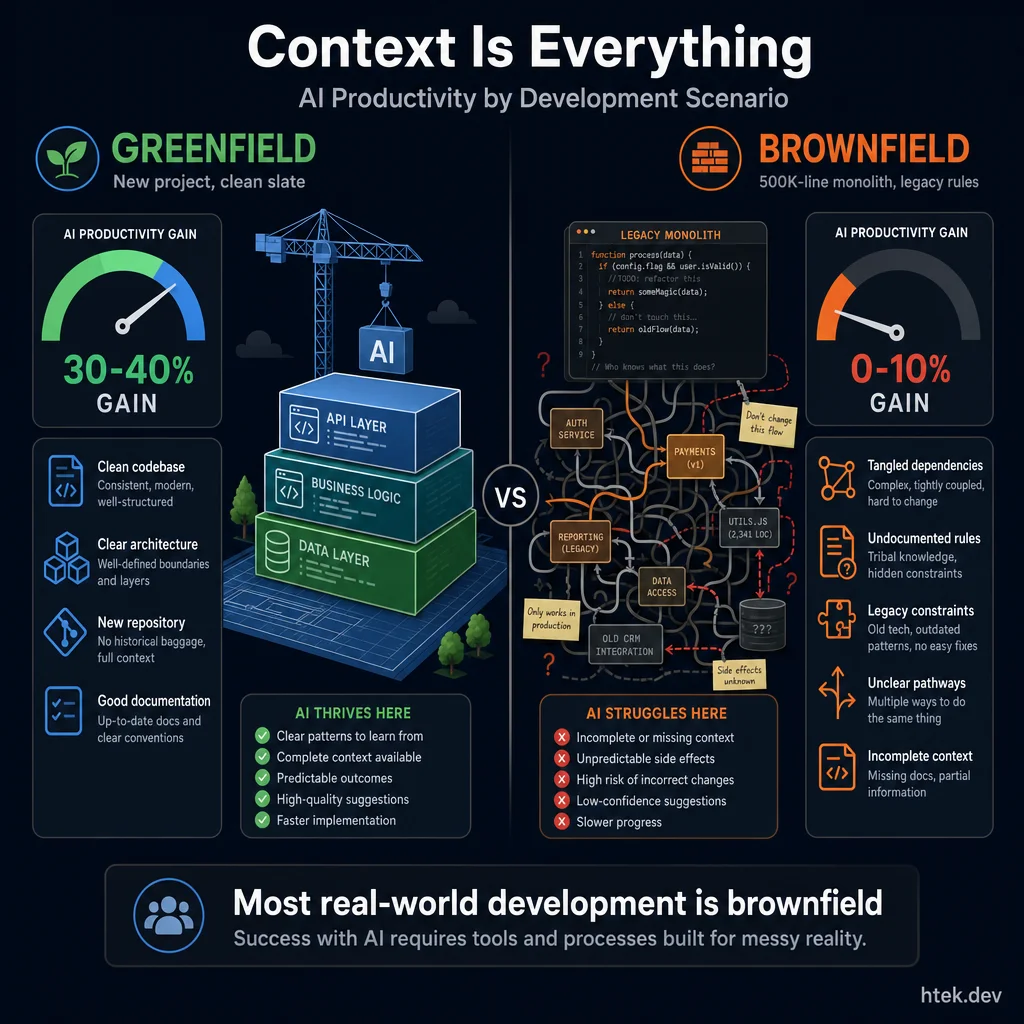 AI excels with clean-slate projects but struggles with the tangled dependencies, undocumented rules, and legacy constraints that define most real-world development.
The study’s most actionable insight is that AI’s value depends heavily on what you’re building and where:
| Scenario | Productivity Gain |
|---|---|
| Greenfield, low complexity | 30–40% |
| Greenfield, high complexity | 10–15% |
| Brownfield, low complexity | 15–20% |
| Brownfield, high complexity | 0–10% (may reduce productivity) |
Most real-world development is brownfield. You’re not spinning up a new React app from scratch — you’re navigating a 500K-line monolith with undocumented business rules and implicit dependencies. Earlier studies, like GitHub’s 2022 Copilot trial, tested primarily greenfield tasks where AI shines. Stanford explicitly corrects for this bias.
Language popularity matters too. AI tools trained on massive Python and JavaScript corpora perform well in those ecosystems. Drop into Cobol, Haskell, or Elixir and the gains evaporate — sometimes going negative.
The Learning Curve Nobody Budgets For
The first 30–100 hours of AI tool usage often make developers slower, not faster. This isn’t failure — it’s the cost of building a mental model for what AI handles well versus what it botches. The biggest productivity impact isn’t in writing code; it’s in understanding codebases, debugging, and navigating requirements.
Teams that push through this curve compound their gains. Teams that don’t fall further behind. As Denisov-Blanch put it:
“The ‘rich get richer’ effect is real. We’re seeing a growing gap between teams that learn quickly and those that don’t.”
The Perception Gap: Developers Don’t Know Their Own Numbers
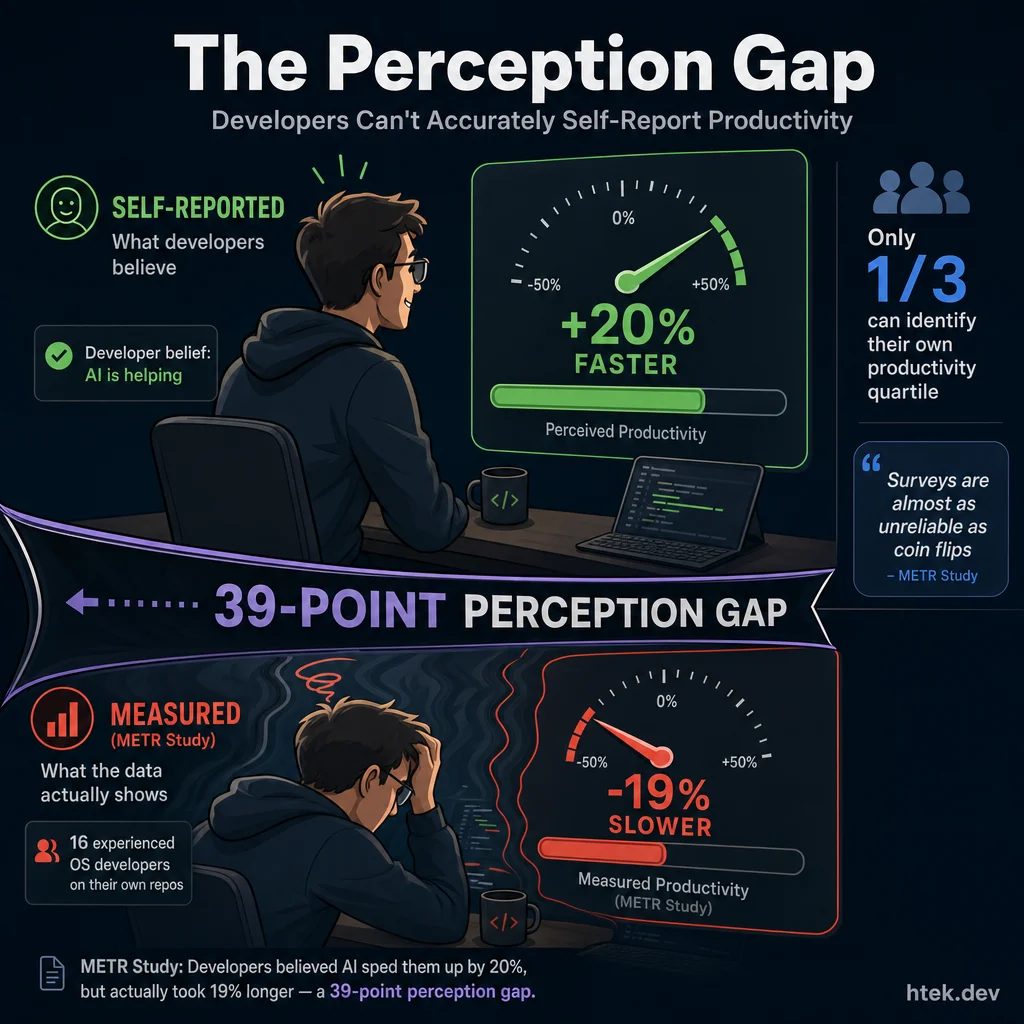 The METR study found experienced developers believed AI sped them up by 20%, but measured data showed they actually took 19% longer — a staggering 39-point perception gap.
This one’s uncomfortable. Stanford found an average ~30 percentage point gap between self-reported and measured productivity. Only one-third of developers can accurately estimate their own productivity quartile. Surveys are, in the study’s words, “almost as unreliable as coin flips.”
The METR counter-study (arXiv paper) drives this home: 16 experienced open-source developers working on their own repos took 19% longer with AI tools — yet believed AI had sped them up by 20%. That’s a 39-point perception gap. The developers used Cursor Pro with Claude 3.5/3.7 Sonnet on repos averaging 22K+ stars and 1M+ lines of code.
Why the slowdown? Overreliance on AI for tasks where expert knowledge is faster, time spent reviewing and fixing generated code, and high quality standards in mature repos that AI doesn’t automatically meet.
What DORA and SPACE Tell Us
Google’s 2025 DORA Report (full report) surveyed nearly 5,000 technology professionals and found 90% use AI daily. But the headline finding echoes Stanford: AI is an amplifier, not a fixer. It magnifies the strengths of high-performing organizations and the dysfunctions of struggling ones.
The updated SPACE framework for AI — built on the original SPACE dimensions by Nicole Forsgren and the Microsoft Research team — confirms from a survey of 500+ developers that AI boosts satisfaction and efficiency on routine tasks but shows less evidence of impact on collaboration. Effective integration depends on team culture, not just tooling.
Microsoft’s own field experiments across 4,867 developers at Microsoft, Accenture, and a Fortune 100 company found a 26% increase in completed tasks — but notably, less experienced developers had higher adoption and greater gains. McKinsey’s analysis of 300 publicly traded companies found that top performers don’t just adopt AI tools — they rethink roles, processes, and performance enablers.
What Engineering Leaders Should Actually Do
The data from Stanford, METR, DORA, and Bain’s research converge on a few clear actions:
- Measure net output, not gross volume. Track functionality delivered after rework, not PR counts or lines generated.
- Budget for the learning curve. Give teams 30–100 hours to build AI fluency before expecting returns.
- Clean your codebase first. Teams with strong engineering hygiene — tests, types, documentation, modularity — extract dramatically more value from AI. Messy codebases get amplified mess.
- Don’t trust surveys alone. Self-reported productivity gains are systematically inflated. Use objective measurement alongside developer sentiment.
- Differentiate by task type. Route greenfield and low-complexity work through AI-heavy workflows. Keep brownfield, high-complexity work human-led with AI as a supporting tool.
The Bottom Line
AI’s ROI in software engineering is real — but it’s 10–15% for most teams, not the 60% that sells licenses. The Stanford HAI team expects these numbers to improve as models and workflows mature. But right now, the gap between AI hype and measured reality is the most important data point in the industry.
The teams winning aren’t the ones adopting AI fastest. They’re the ones measuring honestly, investing in codebase quality, and compounding small gains into real competitive advantage. As I wrote about in building the future with AI-powered development, the shift is from writing code to directing it — but directing well requires the discipline to know what the data actually says.